Using the Data Tool
Everything you need to know about data, Scorecards, and KPIs in Ninety.

Written by Tommy Mains
Updated at May 15th, 2024
Table of Contents
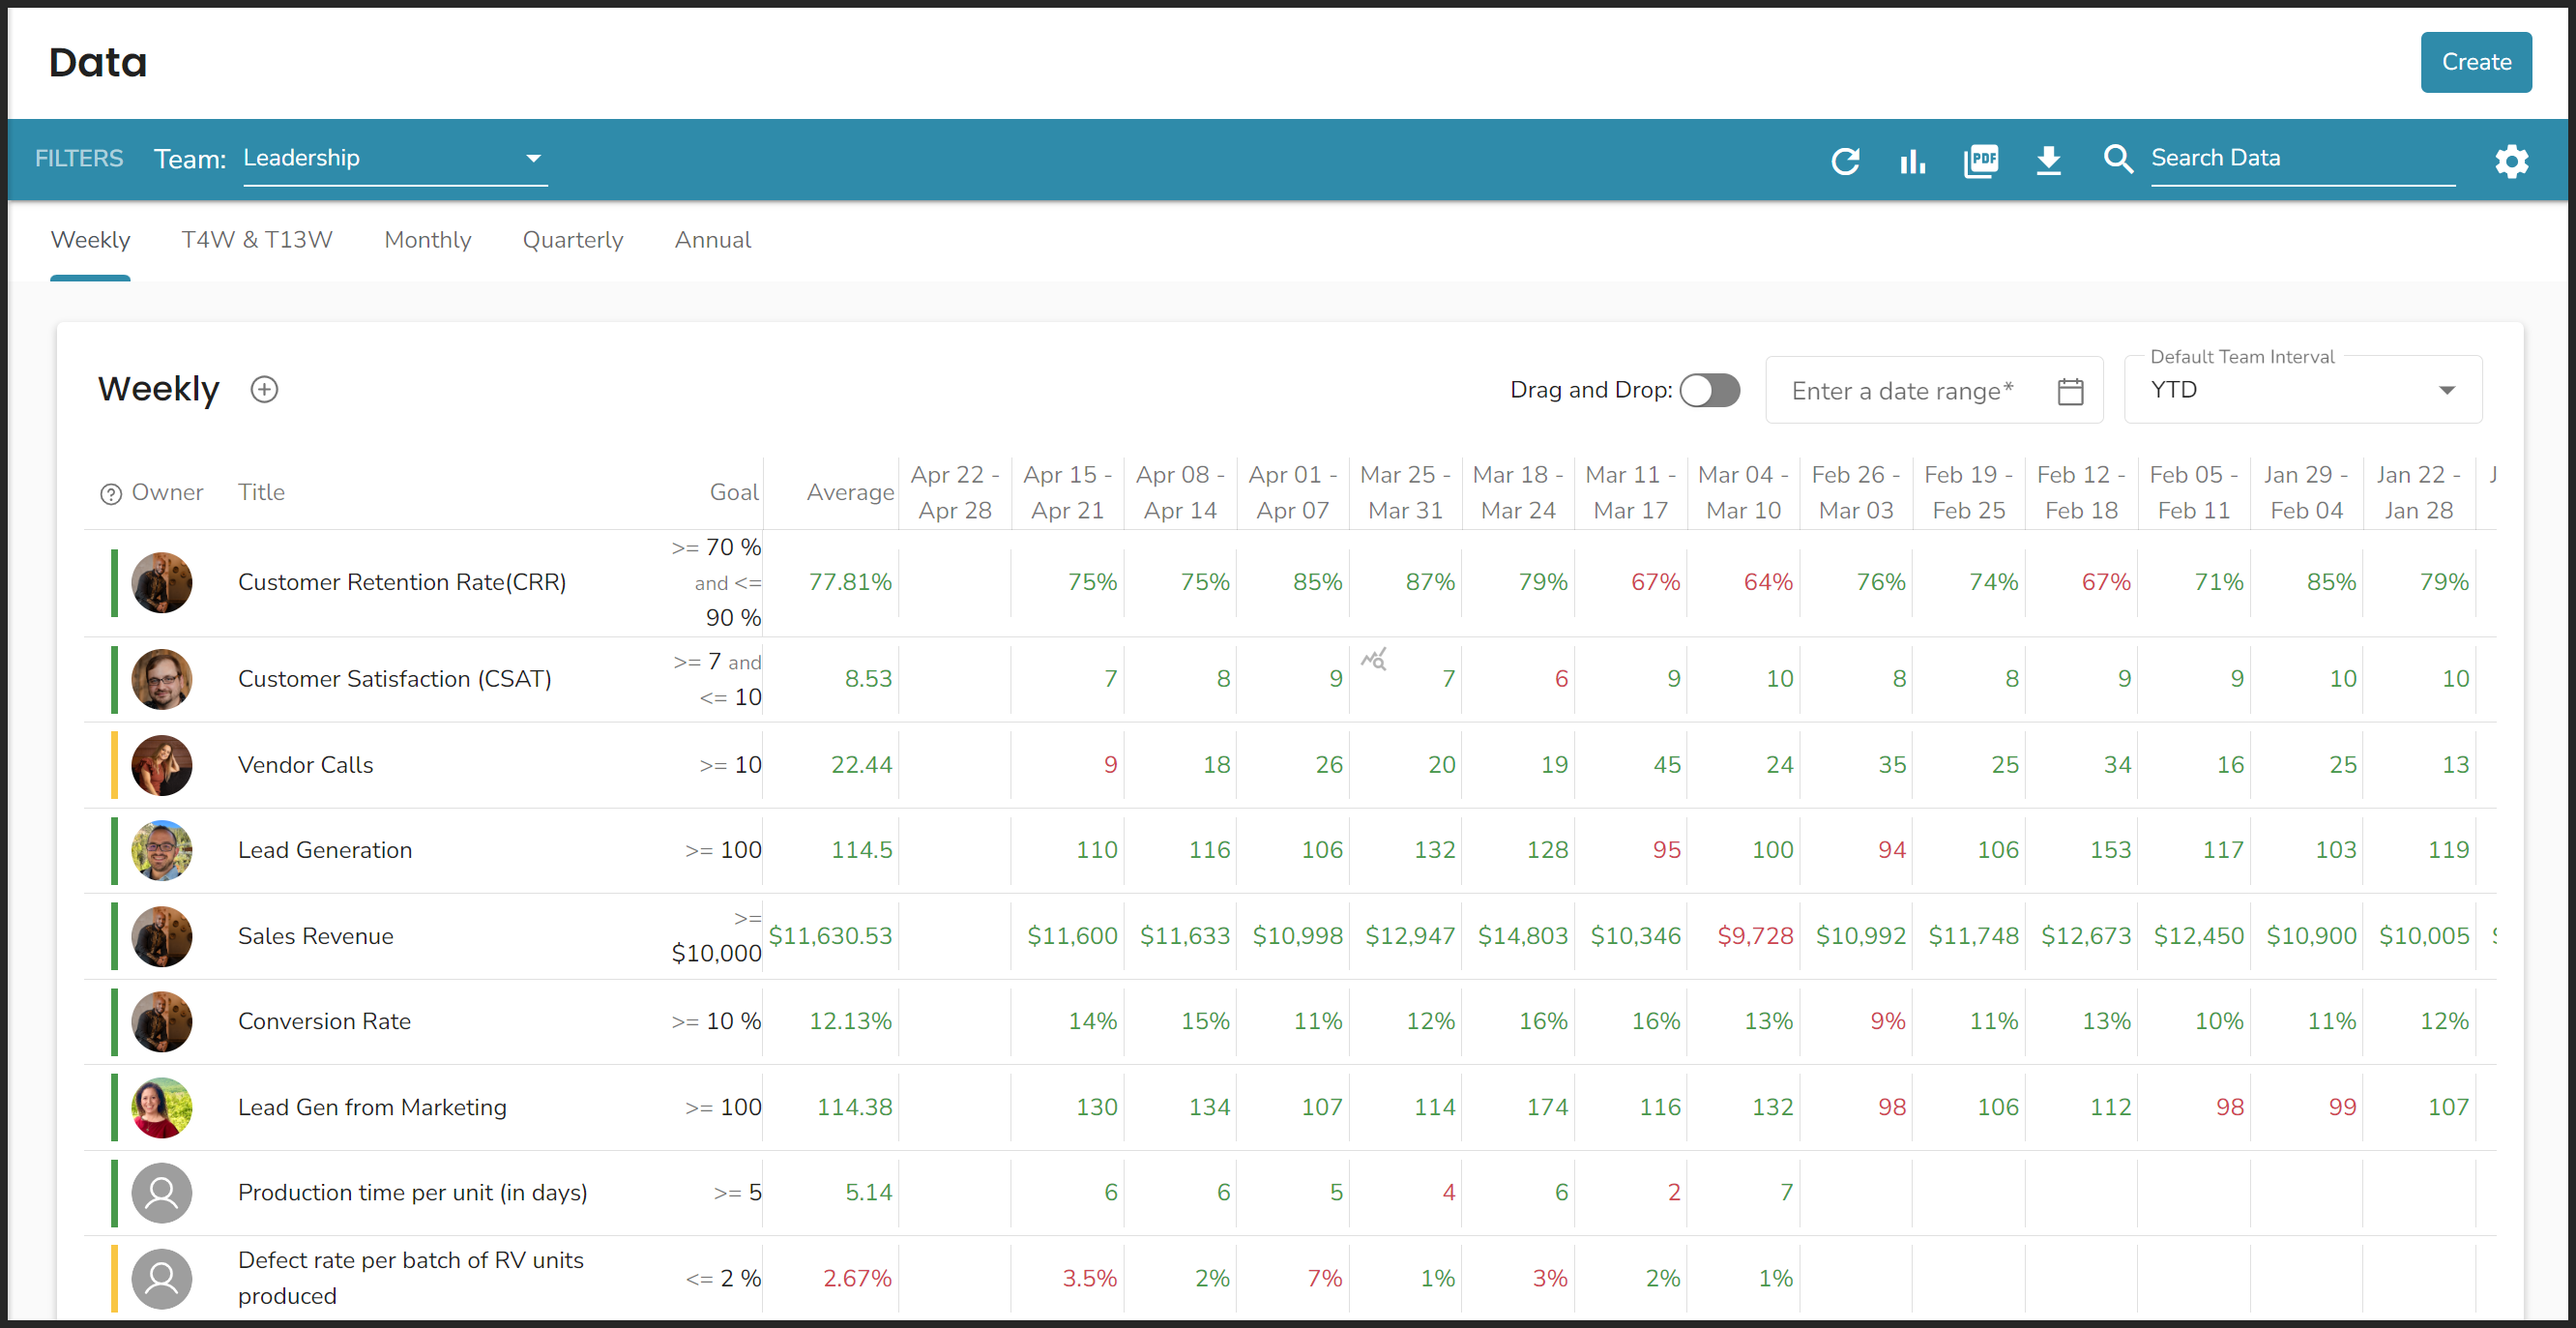
The Data Tool
The Data tool simplifies setting up and managing your team’s Scorecard to keep track of goals on five levels:
- Organization-wide
- Leadership Team
- Departmental
- Teams
- Individuals
Reviewing the Data tool every week is a critical function of team meetings.
The primary functions of the Data tool include:
- Creating KPIs
- Monitoring Scorecards
- Customizing data
- Tracking trends
- Aligning targets
- Inputting KPI data
📖 Are you new to the Data Tool? Check out our introduction article here.
Operating Scorecards According to Your User Role
The functionality of the Data tool changes based on each user's role in Ninety. Choose your user role below to see how to use the Data tool (Owners, Admins, and Managers have similar functionality).
How Do I Know My User Role?
To find your user role and permission level:
- Click your name at the bottom of the left navigation.
- Note your user role under your name.
Using the Data Tool as an Owner, Admin, or Manager
With Owner, Admin, or Manager level permissions, you can:
- Create new KPIs
- Add KPIs to Scorecards
- Own KPIs
- Input scores
- Edit existing KPIs
- Remove KPIs
- Access Data Settings
- Add notes to KPIs
- And more
KPI Basics
Creating KPIs
To create a new KPI:
- Click Data from the left navigation.
- Select a team from the dropdown.
- Choose a Scorecard (Weekly, Trailing, Monthly, Quarterly, or Annual).
- Click the plus sign.
- Click Create and Add a New KPI.
- Enter the title and other information.
- Click Save.
Adding KPIs
To add an existing KPI to one of your team’s Scorecards:
- Click Data from the left navigation.
- Select a team from the dropdown.
- Choose a Scorecard (Weekly, Trailing, Monthly, Quarterly, or Annual).
- Click the plus sign.
- Click Add an Existing KPI.
- Search for and then click the KPI you wish to add.
- Click Save.
Editing KPIs
While editing KPIs, all changes are saved automatically.
To edit an existing KPI:
- Click Data from the left navigation.
- Select a team from the dropdown.
- Click on the KPI you wish to edit.
- Change any of the following details:
- Title
- Description
- Unit of measurement
- Goal information
- KPI owner and their Seat
- Make it smart
"Owning" KPIs
To “own” a KPI means to be accountable for its success. Each KPI’s owner has their profile picture featured on the Scorecard. KPI owners should create an Issue about their KPI whenever it’s off track, needs updating, or has consistently surpassed its target.
There are two ways to change a KPI’s owner:
- Click the KPI to open its details card.
- Click the profile photo on the top right of the card.
- Hover over a Seat from the dropdown.
- Click one of the users who occupy that Seat.
Or:
- Click the KPI to open its details card.
- Click the KPI Owner dropdown toward the bottom of the details card.
- Choose a team member.
- (Optional) Select the relevant Seat from the Seat dropdown if this user sits in multiple Seats.
Additional Features
Inputting KPI Scores
You can input scores for your KPIs from the My 90 page or the Data tool page.
Your My 90 workspace shows all KPIs you own across every team. To add scores here:
- Click My 90 from the left navigation.
- Scroll to the Scorecard section.
- Type in your scores to the corresponding KPI and reporting period cell.
- Click the Period Interval dropdown to access your Trailing, Monthly, Quarterly, and Annual Scorecards.
To enter scores using the Data tool:
- Click Data from the left navigation.
- Choose a team from the Team dropdown.
- Click a Scorecard tab to switch off the Weekly Scorecard.
- Locate the KPI.
- Type the score in the reporting period cell.
Removing a KPI
There are two ways to remove a KPI from a Scorecard.
- Permanently delete a KPI.
- Remove a KPI from a single Scorecard.
Permanently Delete
Only a KPI's owner can delete it.
- Click My 90 from the left navigation.
- Right-click the KPI you want to delete.
- Click Delete KPI from Data.
- Click I understand… Delete anyway.
Deleting a KPI removes it from each Scorecard it's on, any Processes it's linked to, and your Vision if it's used there.
Remove from a Scorecard
You can remove a KPI from a Scorecard from the My 90 workspace or the Data tool.
- Click on the KPI you want to remove.
- Click the three dots at the top of the popup.
- Click Remove KPI from Data.
Adding Notes
All licensed users can add notes to KPIs. Having notes available to provide extra context for a KPI’s progress over time helps save time in meetings by having documentation readily available.
To add a note to a KPI:
- Click Data from the left navigation.
- Choose your team from the dropdown.
- Choose a Scorecard (Weekly, Trailing, Monthly, Quarterly, or Annual).
- Click the magnifying glass on the top left of an individual cell on a KPI’s row.
- Write your notes.
- Click Save.
Editing any instance of a KPI changes it on every Scorecard.
Organizing Scorecards
Organize your Scorecards by dragging and dropping KPIs into the order that most benefit your team.
To drag and drop KPIs:
- Click the Drag and Drop toggle on.
- Hover over the KPI you want to move.
- Click and hold the 12 dot icon on the far left of the KPI’s row.
- While holding the click, move your cursor to drag the KPI up or down.
To add line breaks between groups of KPIs:
- Ensure the Drag and Drop toggle is on.
- Hover over the bottom KPI of an identified group.
- Click the bolded line icon on the far left of the KPI’s row.

Customizing Scorecards
 To customize your team’s Scorecard:
- Click Data from the left navigation.
- Choose your team from the dropdown.
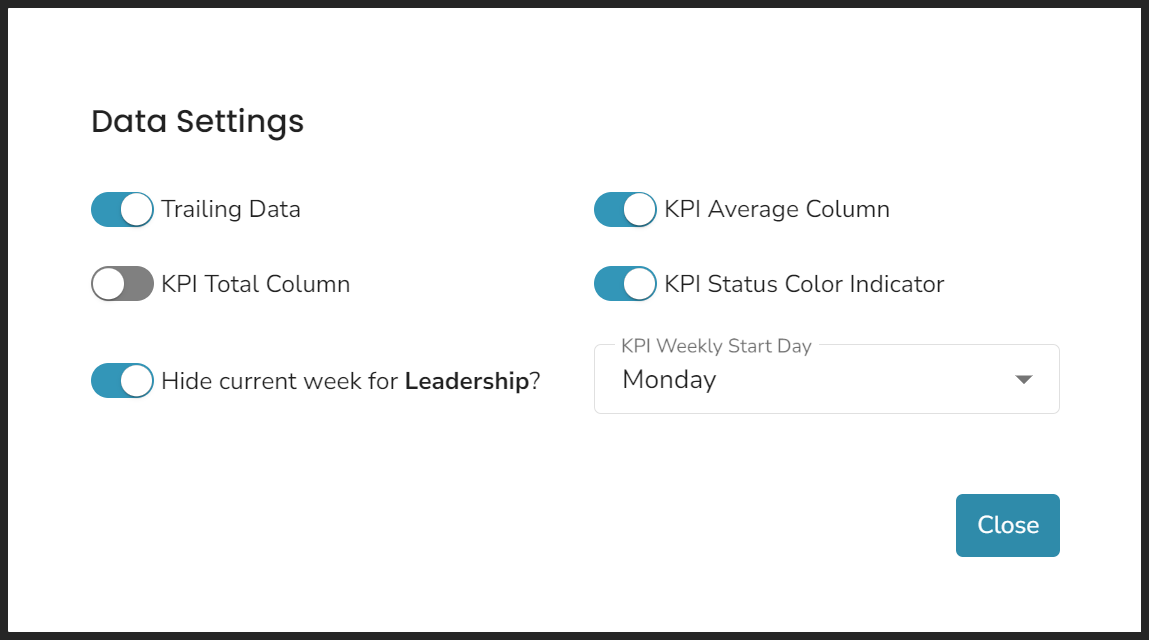
- Click the gear icon on the right of the Filters bar.
Changing any of the Data Settings affects all the team's Scorecards (Weekly, Trailing, Monthly, Quarterly, and Annual).
Trailing Data
With Trailing Data enabled, you have an additional Scorecard tab in the Data tool: Trailing 4 & 13 Weeks.
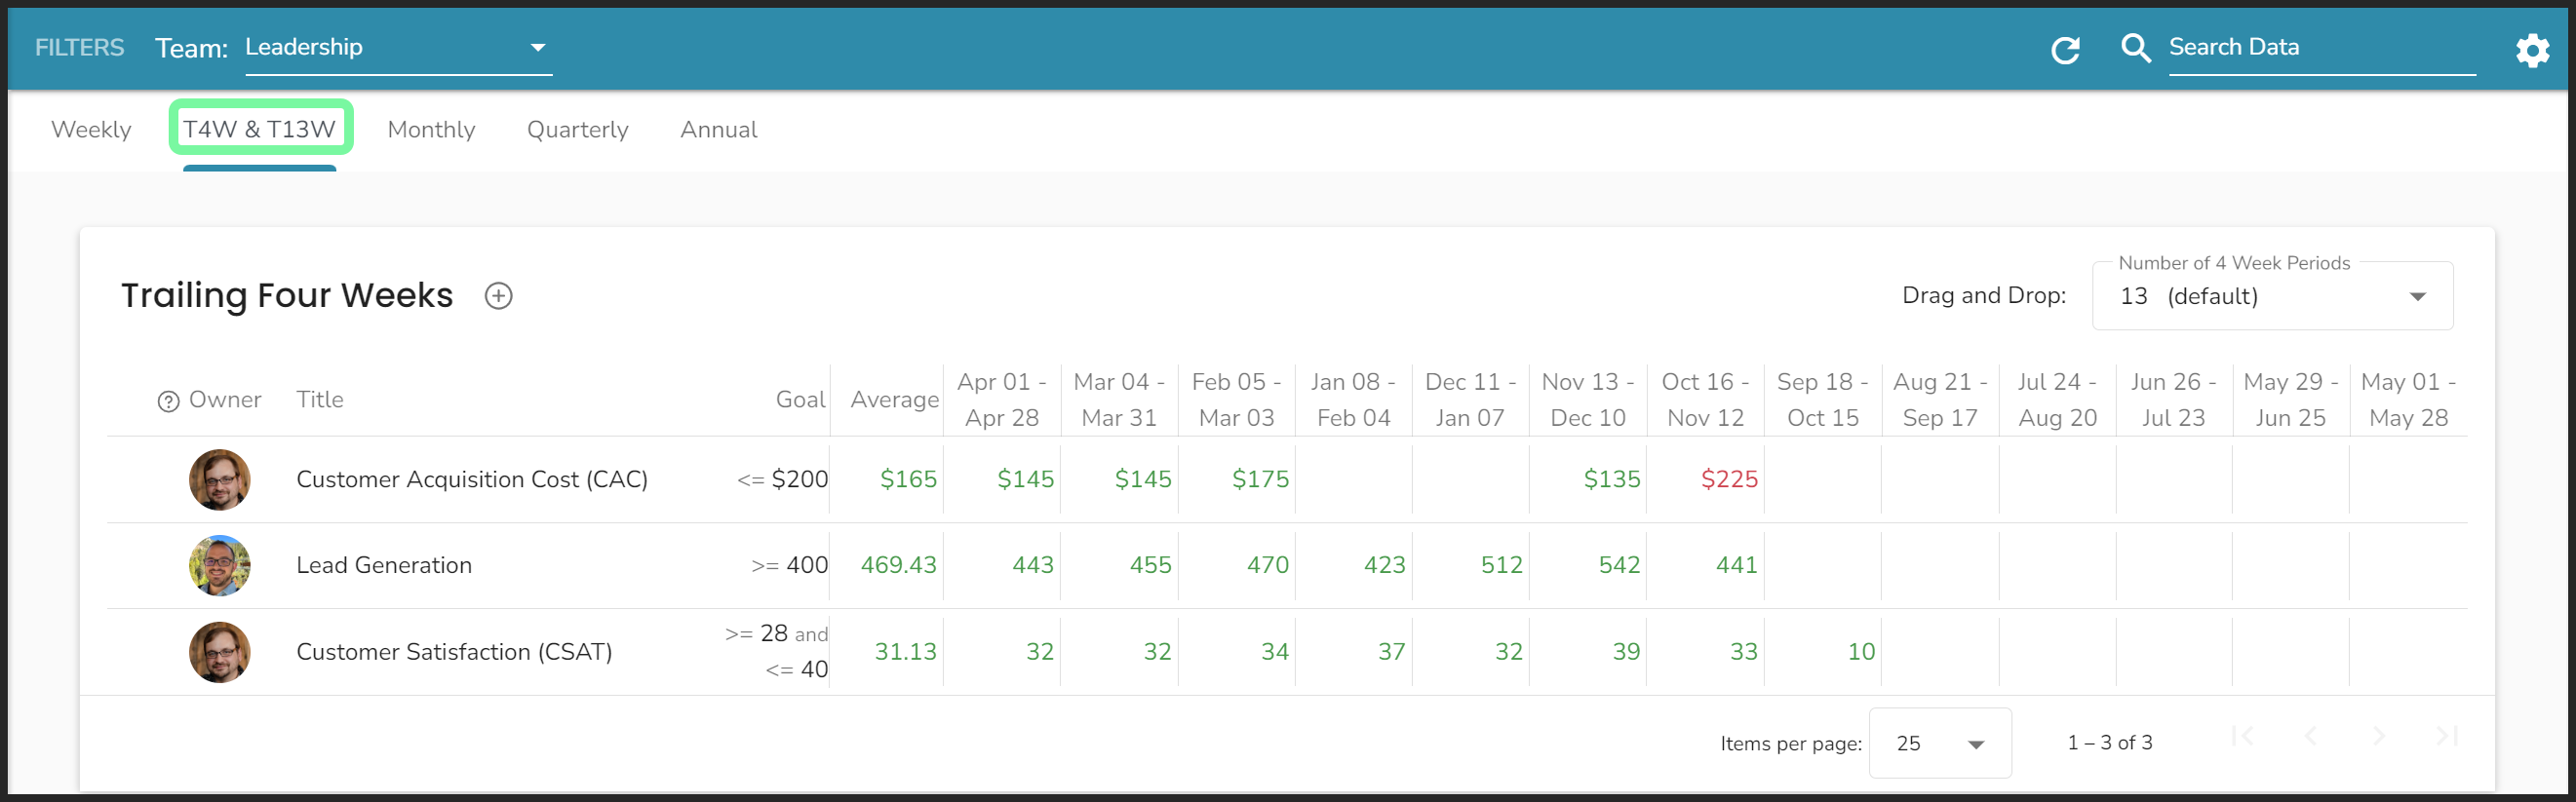
Add pre-existing weekly KPIs to this tab to see real-time calculations of the KPI over trailing 4 or 13-week periods. Each KPI’s goal and scores are carried over directly from their weekly Scorecards.
To add a pre-existing KPI to your Trailing Scorecard:
- Click Data from the left navigation.
- Select a team from the dropdown.
- Click the Trailing Scorecard tab.
- Click the plus sign.
- Click Add an Existing KPI.
- Search for and then click the KPI you wish to add.
- Click Save.
To populate all your team’s non-smart Weekly KPIs to your Trailing Scorecard:
- Click Data from the left navigation.
- Select a team from the dropdown.
- Click the Trailing Scorecard tab.
- Click the plus sign.
- Click Add all Non-Smart KPIs from Weekly Scorecard.
- Click Save.
Displaying the Average or the Total
You can choose to display the average or the total for each KPI.
To turn on or off the average or total column:
- Click the gear icon on the right of the Filters bar.
- Use the toggles to turn on or off a column.
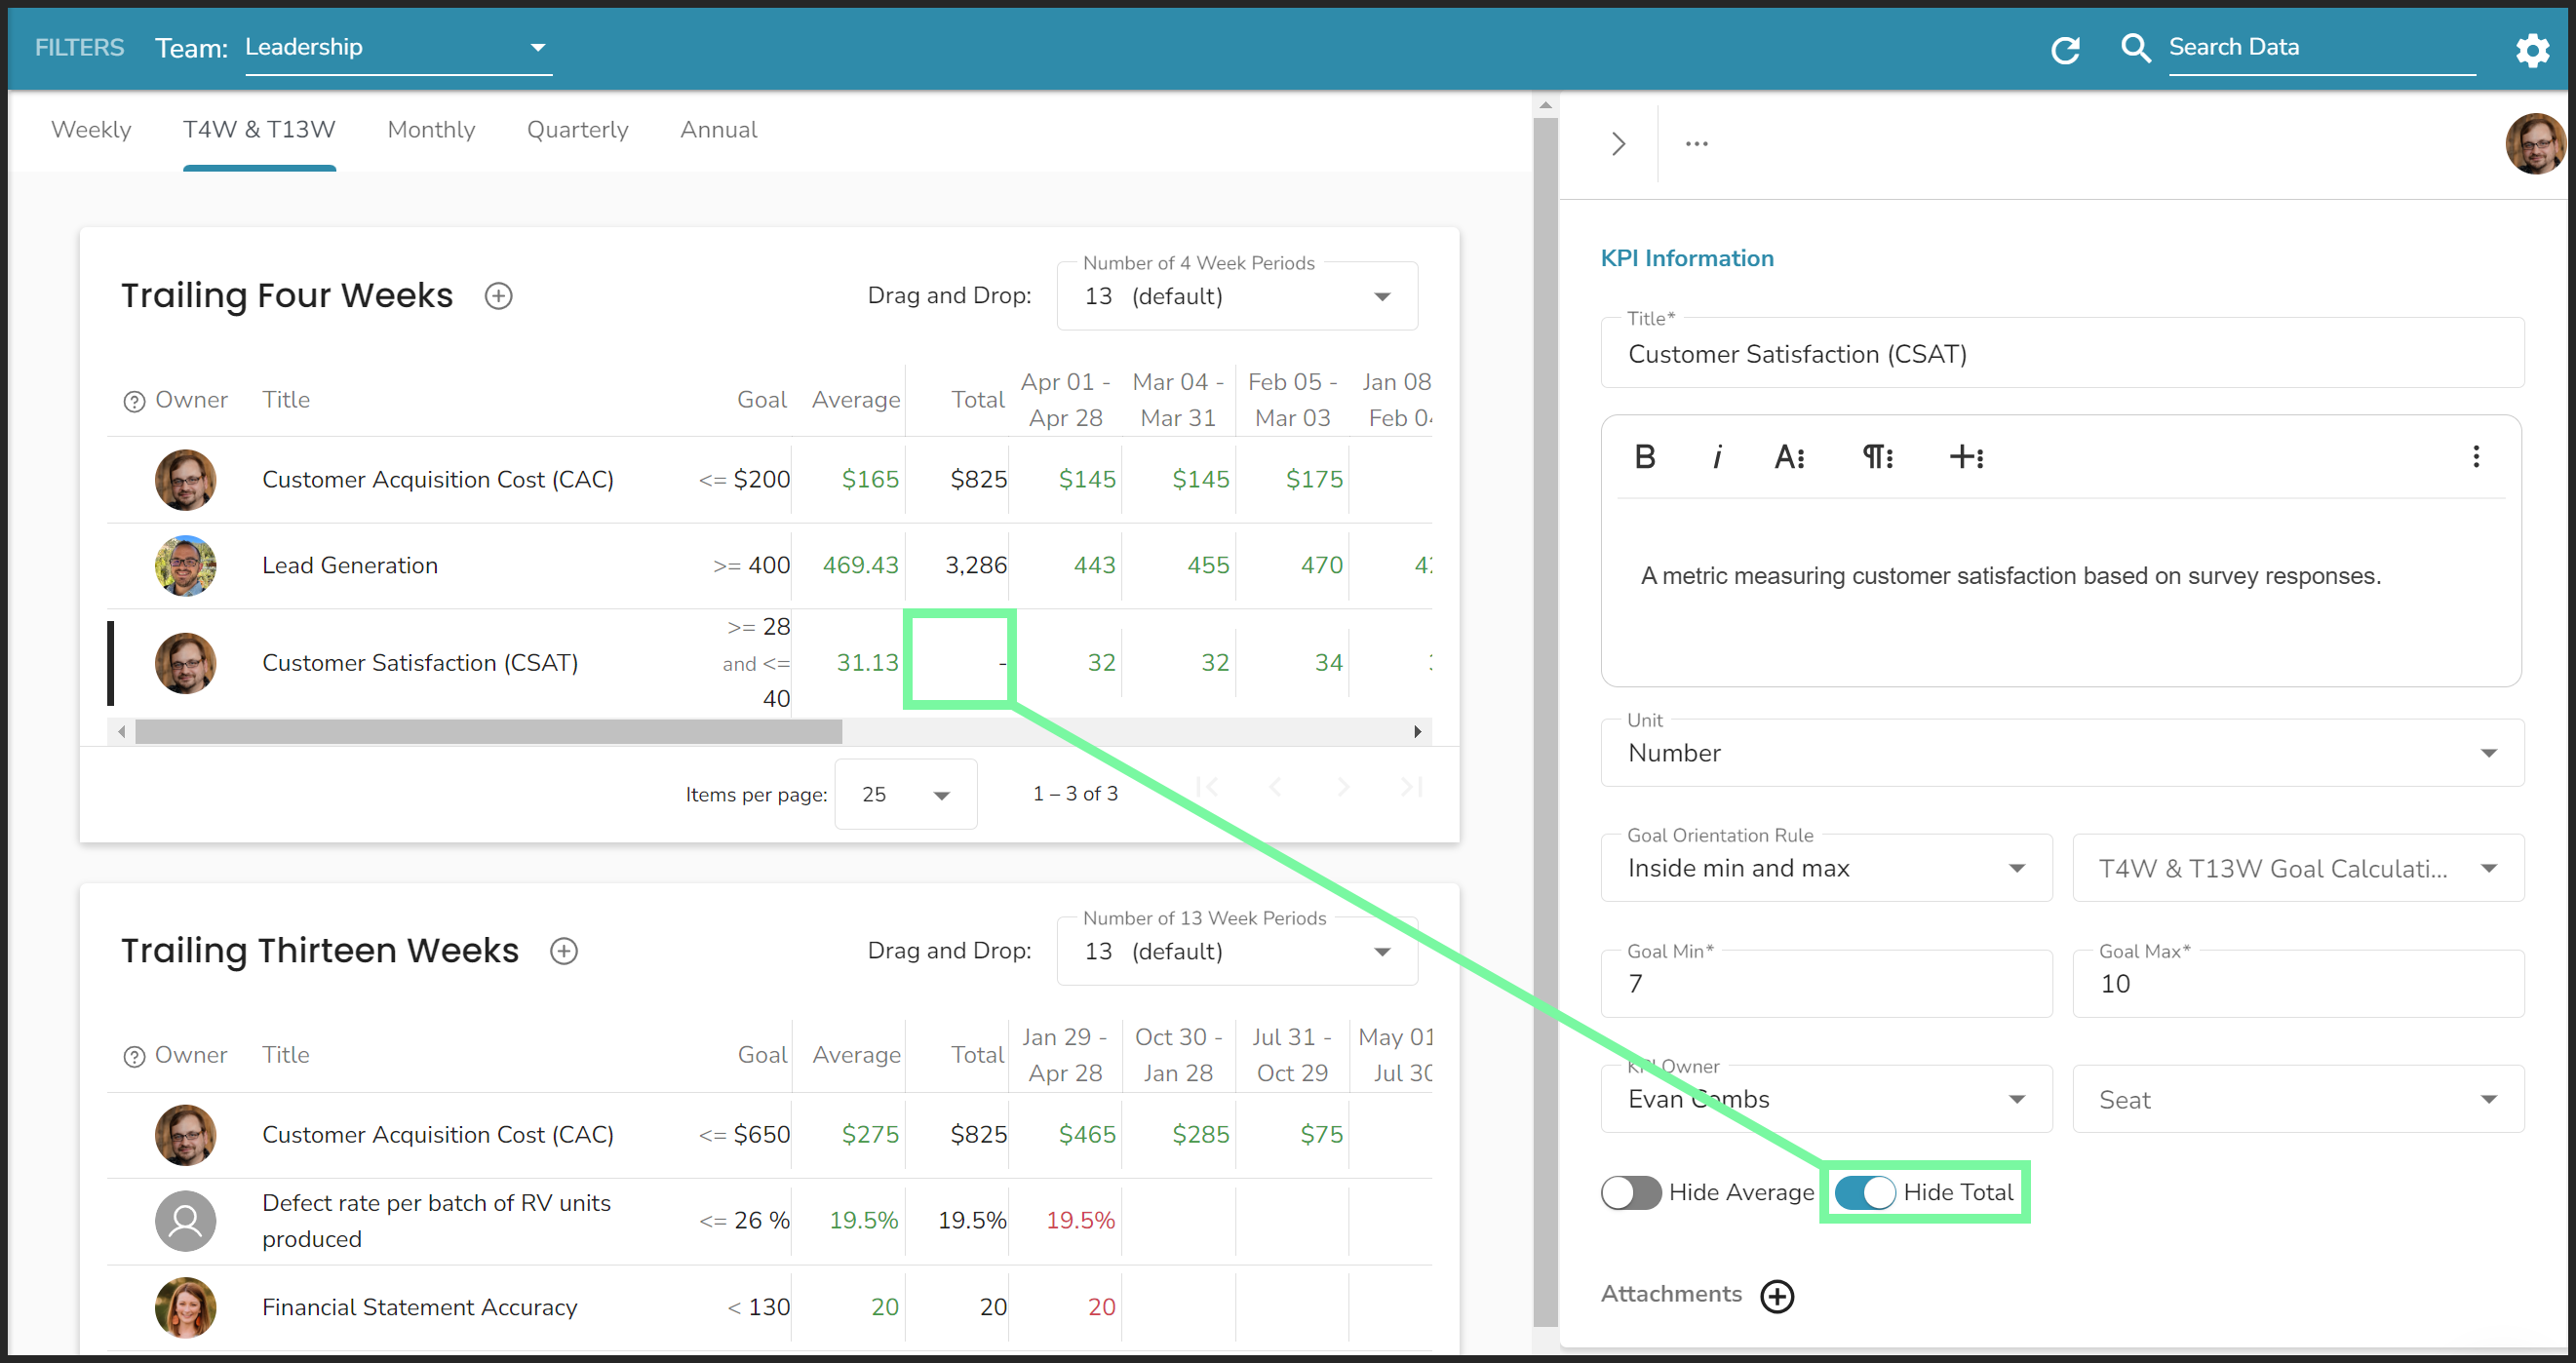
If you have both columns on, you may want to disable one of the columns for a particular KPI. For example, any KPIs based on a percentage would only benefit from the average column, and some CSAT KPIs do not need the total column.
To turn on or off the average or total column on an individual KPI:
- Click on the KPI to open its details card.
- Click the toggle.
KPI Total Column
Enabling the KPI Total column adds a column to all the team’s Scorecards to show the sum total of each KPI.
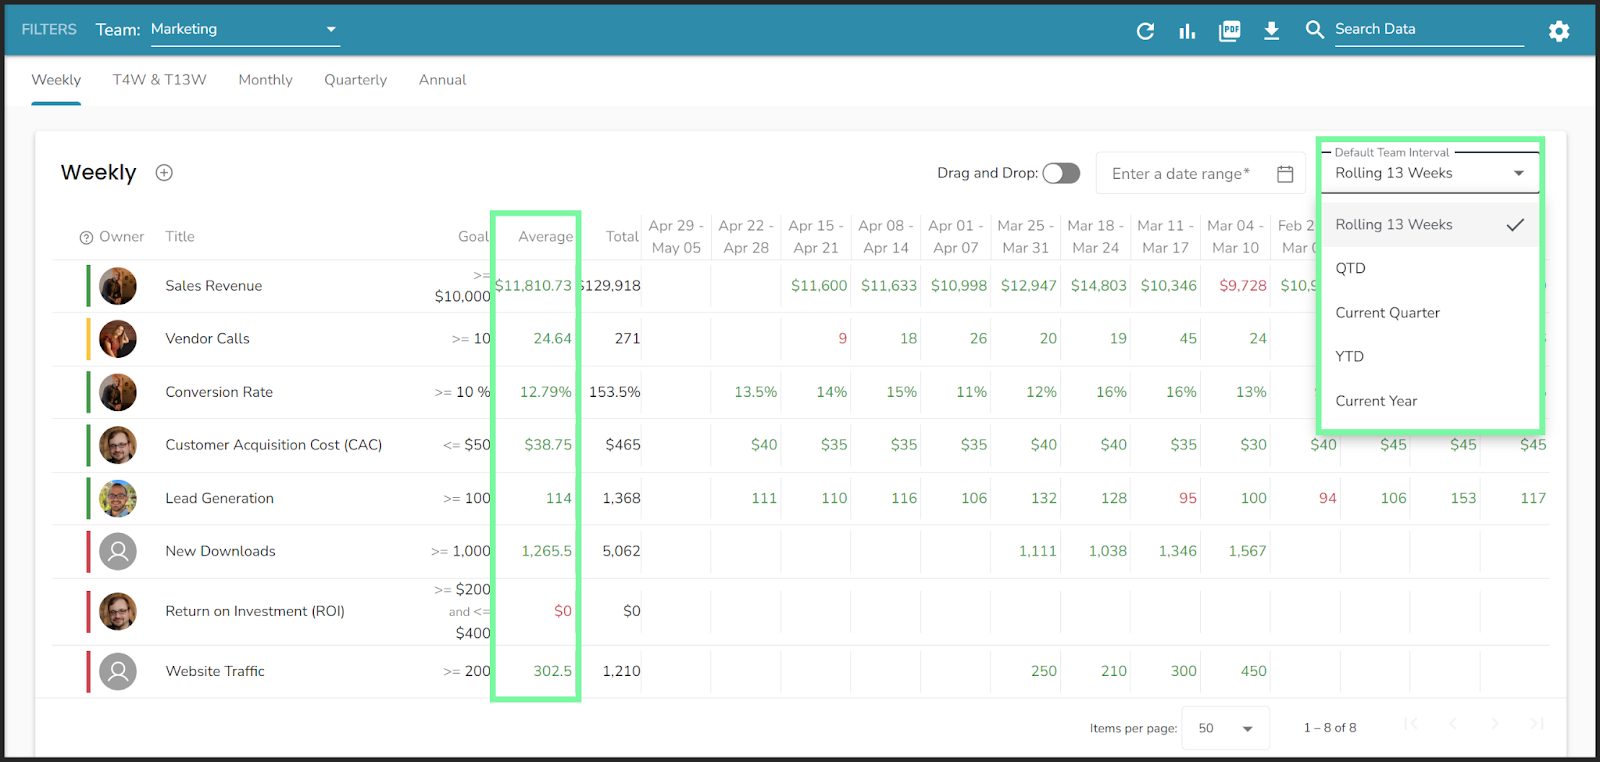
To change the number of reporting periods for the KPIs on a Scorecard, click the dropdown on the top right and choose your preferred option.

Hide Current Week
Hide the current week’s column from your team’s Scorecard by clicking the toggle to its active position.
A similar feature is available for the Monthly, Quarterly, and Annual Scorecard tabs.
KPI Average Column
Enabling the KPI Average column adds a column to all the team’s Scorecards to show the average score of each KPI.
To change the number of reporting periods for the KPIs on a Scorecard, click the dropdown on the top right and choose your preferred option.
KPI Status Color
When the KPI Status Color Indicator toggle in Data Settings is toggled on, a vertical, colored line appears on the far left of each KPI on the team’s Scorecard. The status color is based on each KPI’s goal — often called its target.
🟩 Green indicates the KPI has been on track for the previous three reporting intervals.
🟨 Yellow indicates the KPI was off track at least once over the previous three reporting intervals.
🟥 Red indicates the KPI was off track for the previous three reporting intervals.
Changing the Start Day
Choose the start day for Weekly KPIs that best fits your organization.
There are two ways to change your Scorecard’s start day.
To change it in the Data tool:
- Click Data from the left navigation.
- Click the gear icon on the right of the Filters bar.
- Click the KPI Weekly Start Day dropdown.
- Click a weekday.
Or, to change it in your company’s settings — which will change the start day for the whole organization in Ninety:
- Click your name from the bottom of the left navigation.
- Click Company Settings.
- Click the KPI Weekly Start Day dropdown.
- Click a weekday.
Changing the start day for your Scorecard’s reporting period affects all historical data.
Forecasting Goals
Goal Forecasting allows you to plan ahead. Companies that have busy or slow seasons can use this feature to keep goals on track and note their forecasted seasonal goals. Creating a Goal Forecast doesn't change the entire goal, only the goal for the specified timeframe.
A common example is to account for team member vacations. If Sarah, who is responsible for authoring articles, is going to be out for two weeks in May, you can create a forecast of 0 new articles with a note of "Out of Office." This keeps Sarah's KPI data on track and accurate during her vacation. Once the two weeks are up, her goal automatically goes back to the set number of articles per week.
Creating a Goal Forecast

You must have Manager or higher-level permissions to create or edit a Goal Forecast. We recommend filling in the Notes section of a forecast so you can see why the goal was changed from its normal data.
- Click Data from the left navigation.
- Choose a team from the Team dropdown.
- Click the Graph icon from the filters bar.
- Click a reporting period on a KPI's row.
- Click the paper icon to add a note.
- Click anywhere else on the screen or tap the enter key on your keyboard to save.
- Once the forecast is added, it automatically displays on the Scorecard.
Customizing Goals

All team members can create a custom goal on a KPI. Similar to forecasting, custom goals allow users to account for absences, holidays, and other exceptions.
To customize a KPI's goal for a single reporting period:
- Click Data from the left navigation.
- Choose a team from the Team dropdown.
- Click the magnifying glass in the top left corner of a KPI's reporting period cell.
- Write a custom goal or add a note.
- Click Save.
Using the Data Tool as a Coach
As a coach supporting an organization running on Ninety, you have similar functionality to an Admin in the Data tool, except you cannot own KPIs.
With Coach level permissions, you can:
- Create new KPIs
- Add KPIs to Scorecards
- Edit existing KPIs
- Remove KPIs
- Access Data Settings
- Add notes to KPIs
- And more
KPI Basics
Creating KPIs
To create a new KPI:
- Click Data from the left navigation.
- Select a team from the dropdown.
- Choose a Scorecard (Weekly, Trailing, Monthly, Quarterly, or Annual).
- Click the plus sign.
- Click Create and Add a New KPI.
- Enter the title and other information.
- Click Save.
Learn more about creating smart KPIs below.
Adding KPIs to a Scorecard
To add an existing KPI to one of your team’s Scorecards:
- Click Data from the left navigation.
- Select a team from the dropdown.
- Choose a Scorecard (Weekly, Trailing, Monthly, Quarterly, or Annual).
- Click the plus sign.
- Click Add an Existing KPI.
- Search for and then click the KPI you wish to add.
- Click Save.
Editing Existing KPIs
While editing KPIs, all changes are saved automatically.
- Click Data from the left navigation.
- Select a team from the dropdown.
- Click on the KPI you wish to edit.
- Change any of the following details:
- Title
- Description
- Unit of measurement
- Goal information
- KPI owner and their Seat
- Make it smart
Additional Features
Inputting KPI Scores
You can input scores for your KPIs from the My 90 page or the Data tool page.
Your My 90 workspace shows all KPIs you own across every team. To add scores here:
- Click My 90 from the left navigation.
- Scroll to the Scorecard section.
- Type in your scores to the corresponding KPI and reporting period cell.
- Click the Period Interval dropdown to access your Trailing, Monthly, Quarterly, and Annual Scorecards.
To enter scores using the Data tool:
- Click Data from the left navigation.
- Choose a team from the Team dropdown.
- Click a Scorecard tab to switch off the Weekly Scorecard.
- Locate the KPI.
- Type the score in the reporting period cell.
Removing a KPI
There are two ways to remove a KPI from a Scorecard.
- Permanently delete a KPI.
- Remove a KPI from a single Scorecard.
Permanently Delete
Only a KPI's owner can delete it.
- Click My 90 from the left navigation.
- Right-click the KPI you want to delete.
- Click Delete KPI from Data.
- Click I understand… Delete anyway.
Deleting a KPI removes it from each Scorecard it's on, any Processes it's linked to, and your Vision if it's used there.
Remove from a Scorecard
You can remove a KPI from a Scorecard from the My 90 workspace or the Data tool.
- Click on the KPI you want to remove.
- Click the three dots at the top of the popup.
- Click Remove KPI from Data.
Adding Notes
All licensed users can add notes to KPIs. Having notes available to provide extra context for a KPI’s progress over time helps save time in meetings by having documentation readily available.
To add a note to a KPI:
- Click Data from the left navigation.
- Choose your team from the dropdown.
- Choose a Scorecard (Weekly, Trailing, Monthly, Quarterly, or Annual).
- Click the magnifying glass on the top left of an individual cell on a KPI’s row.
- Write your notes.
- Click Save.
Editing any instance of a KPI changes it on every Scorecard.
Organizing Scorecards
Organize your Scorecards by dragging and dropping KPIs into the order that most benefit your team.
To drag and drop KPIs:
- Click the Drag and Drop toggle on.
- Hover over the KPI you want to move.
- Click and hold the 12 dot icon on the far left of the KPI’s row.
- While holding the click, move your cursor to drag the KPI up or down.
To add line breaks between groups of KPIs:
- Ensure the Drag and Drop toggle is on.
- Hover over the bottom KPI of an identified group.
- Click the bolded line icon on the far left of the KPI’s row.
Customizing Scorecards
To customize your team’s Scorecard:
- Click Data from the left navigation.
- Choose your team from the dropdown.
- Click the gear icon on the right of the Filters bar.
Changing any of the Data Settings affects all the team's Scorecards (Weekly, Trailing, Monthly, Quarterly, and Annual).
Trailing Data
With Trailing Data enabled, you have an additional Scorecard tab in the Data tool: Trailing 4 & 13 Weeks.
Add pre-existing weekly KPIs to this tab to see real-time calculations of the KPI over trailing 4 or 13-week periods. Each KPI’s goal and scores are carried over directly from their weekly Scorecards.
To add a pre-existing KPI to your Trailing Scorecard:
- Click Data from the left navigation.
- Select a team from the dropdown.
- Click the Trailing Scorecard tab.
- Click the plus sign.
- Click Add an Existing KPI.
- Search for and then click the KPI you wish to add.
- Click Save.
To populate all your team’s non-smart Weekly KPIs to your Trailing Scorecard:
- Click Data from the left navigation.
- Select a team from the dropdown.
- Click the Trailing Scorecard tab.
- Click the plus sign.
- Click Add all Non-Smart KPIs from Weekly Scorecard.
- Click Save.
Displaying the Average or the Total
You can choose to display the average or the total for each KPI.
To turn on or off the average or total column:
- Click the gear icon on the right of the Filters bar.
- Use the toggles to turn on or off a column.
If you have both columns on, you may want to disable one of the columns for a particular KPI. For example, any KPIs based on a percentage would only benefit from the average column, and some CSAT KPIs do not need the total column.
To turn on or off the average or total column on an individual KPI:
- Click on the KPI to open its details card.
- Click the toggle.
KPI Total Column
Enabling the KPI Total column adds a column to all the team’s Scorecards to show the sum total of each KPI.
To change the number of reporting periods for the KPIs on a Scorecard, click the dropdown on the top right and choose your preferred option.
Hide Current Week
Hide the current week’s column from your team’s Scorecard by clicking the toggle to its active position.
A similar feature is available for the Monthly, Quarterly, and Annual Scorecard tabs.
KPI Average Column
Enabling the KPI Average column adds a column to all the team’s Scorecards to show the average score of each KPI.
To change the number of reporting periods for the KPIs on a Scorecard, click the dropdown on the top right and choose your preferred option.
KPI Status Color
When the KPI Status Color Indicator toggle in Data Settings is toggled on, a vertical, colored line appears on the far left of each KPI on the team’s Scorecard. The status color is based on each KPI’s goal — often called its target.
🟩 Green indicates the KPI has been on track for the previous three reporting intervals.
🟨 Yellow indicates the KPI was off track at least once over the previous three reporting intervals.
🟥 Red indicates the KPI was off track for the previous three reporting intervals.
Changing the Start Day
Choose the start day for Weekly KPIs that best fits your organization. There are two ways to change your Scorecard’s start day.
To change it in the Data tool:
- Click Data from the left navigation.
- Click the gear icon on the right of the Filters bar.
- Click the KPI Weekly Start Day dropdown.
- Click a weekday.
Or, to change it in your company’s settings — which will change the start day for the whole organization in Ninety:
- Click your name from the bottom of the left navigation.
- Click Company Settings.
- Click the KPI Weekly Start Day dropdown.
- Click a weekday.
Changing the start day for your Scorecard’s reporting period affects all historical data.
Forecasting Goals
Goal Forecasting allows you to plan ahead. Companies that have busy or slow seasons can use this feature to keep goals on track and note their forecasted seasonal goals. Creating a Goal Forecast doesn't change the entire goal, only the goal for the specified timeframe.
A common example is to account for team member vacations. If Sarah, who is responsible for authoring articles, is going to be out for two weeks in May, you can create a forecast of 0 new articles with a note of "Out of Office." This keeps Sarah's KPI data on track and accurate during her vacation. Once the two weeks are up, her goal automatically goes back to the set number of articles per week.
Creating a Goal Forecast
You must have Manager or higher-level permissions to create or edit a Goal Forecast. We recommend filling in the Notes section of a forecast so you can see why the goal was changed from its normal data.
- Click Data from the left navigation.
- Choose a team from the Team dropdown.
- Click the Graph icon from the filters bar.
- Click a reporting period on a KPI's row.
- Click the paper icon to add a note.
- Click anywhere else on the screen or tap the enter key on your keyboard to save.
- Once the forecast is added, it automatically displays on the Scorecard.
Customizing Goals
All team members can create a custom goal on a KPI. Similar to forecasting, custom goals allow users to account for absences, holidays, and other exceptions.
To customize a KPI's goal for a single reporting period:
- Click Data from the left navigation.
- Choose a team from the Team dropdown.
- Click the magnifying glass in the top left corner of a KPI's reporting period cell.
- Write a custom goal or add a note.
- Click Save.
Using the Data Tool as a Team Member
With Team Member level permissions, you can:
- Own KPIs
- Input scores
- Add notes to KPIs
To create your own KPI or perform any other functions in the Data tool not listed below, contact your team's leader.
Owning KPIs
To “own” a KPI means to be accountable for its success. Each KPI’s owner has their profile picture featured on the Scorecard. KPI owners should create an Issue about their KPI whenever it’s off track, needs updating, or has consistently surpassed its target.
Inputting KPI Scores
You can input scores for your KPIs from the My 90 page or the Data tool page.
Your My 90 workspace shows all KPIs you own across every team. To add scores here:
- Click My 90 from the left navigation.
- Scroll to the Scorecard section.
- Type in your scores to the corresponding KPI and reporting period cell.
- Click the Period Interval dropdown to access your Trailing, Monthly, Quarterly, and Annual Scorecards.
To enter scores using the Data tool:
- Click Data from the left navigation.
- Choose a team from the Team dropdown.
- Click a Scorecard tab to switch off the Weekly Scorecard.
- Locate the KPI.
- Type the score in the reporting period cell.
Adding Notes
All licensed users can add notes to KPIs. Having notes available to provide extra context for a KPI’s progress over time helps save time in meetings by having documentation readily available.
To add a note to a KPI:
- Click Data from the left navigation.
- Choose your team from the dropdown.
- Choose a Scorecard (Weekly, Trailing, Monthly, Quarterly, or Annual).
- Click the magnifying glass on the top left of an individual cell on a KPI’s row.
- Write your notes.
- Click Save.
Editing any instance of a KPI changes it on every Scorecard.
Using the Data Tool as an Observer
With Observer level permissions, you can:
- Own KPIs
To create your own KPI or perform any other functions in the Data tool not listed below, contact your team's leader.
Owning KPIs
To “own” a KPI means to be accountable for its success. Each KPI’s owner has their profile picture featured on the Scorecard. KPI owners should create an Issue about their KPI whenever it’s off track, needs updating, or has consistently surpassed its target.