Issues Dashboard
Track Issues solved. Compare to the previous meeting's metrics and your team's solve rate goal.

Written by Amanda Barfield
Updated at April 1st, 2024
-
 Insights
-
 Data
Data
-
 Rocks
Rocks
-
 To-Dos
-
 Issues
-
 Meetings
-
 Headlines
-
 Vision
-
 Org Chart
-
 1-on-1
-
 Process
-
 Directory
-
 Mastery
-
 Assessments
-
 Integrations and Beta
-
 Account Options and Troubleshooting
Table of Contents
What is the Issues Dashboard?
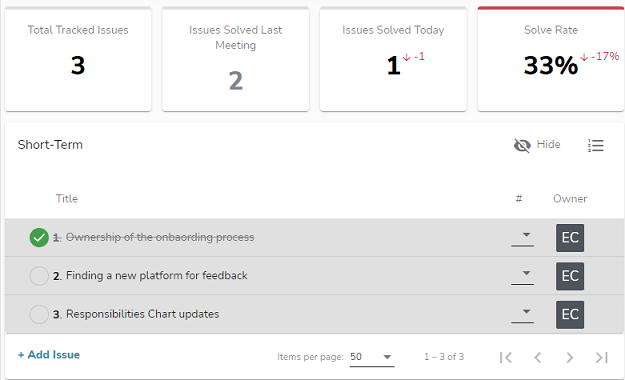
The Issues Dashboard is a tool used by teams to track how often Short-Term Issues are being solved.
- Total Tracked Issues for this team
- Total Issues Solved Last Meeting
- Total Issues Solved Today (in the current meeting), with an indicator showing the difference from the previous meeting
- Solve Rate percentage for the current meeting, with an indicator against the solve rate goal
Accessing the Issues Dashboard in a Meeting
When in a Meeting, you can access the Issues Dashboard by clicking Show on the right side. Click Hide to minimize the Issues Dashboard.
Note: This functionality exists during the Issues section of a meeting. If you're customizing a meeting agenda, it displays whenever the Issues segment is added.
Setting the Desired Solve Rate (per Team)
This functionality can only be modified by the Manager role or above. To edit the desired "Issue solve rate" (percentage) per meeting, open Issues OR view the Issues segment of a meeting and click the Gear Icon on the top-right of the screen.
Enter the percentage rate under "Set desired solve rate" and click Save. This is now the Solve Rate goal for each meeting. Unchecking this section leaves the solved percentage but removes the difference indicator.
Note: This is a Team level setting and is not company-wide.

Viewing a Previous Meeting's Issues Data
The results of the meeting's solved Issues display in the meeting recap email sent as part of the conclusion. You can also review a previous meeting's Issue tracking data by reviewing the details on the Meetings page.