Using the Data Tool
Everything you need to know about data, Scorecards, and KPIs in Ninety.

Written by Tommy Mains
Updated at February 21st, 2025
-
 Insights
-
 Data
Data
-
 Rocks
Rocks
-
 To-Dos
-
 Issues
-
 Meetings
-
 Headlines
-
 Vision
-
 Org Chart
-
 1-on-1
-
 Process
-
 Directory
-
Knowledge Portal
-
 Mastery
-
 Assessments
-
Partner Hub
-
 Integrations and Beta
-
 Account Options and Troubleshooting
-
Mobile (Beta)
Table of Contents
The Data Tool
The Data tool simplifies setting up and managing your team’s Scorecard to keep track of goals on five levels: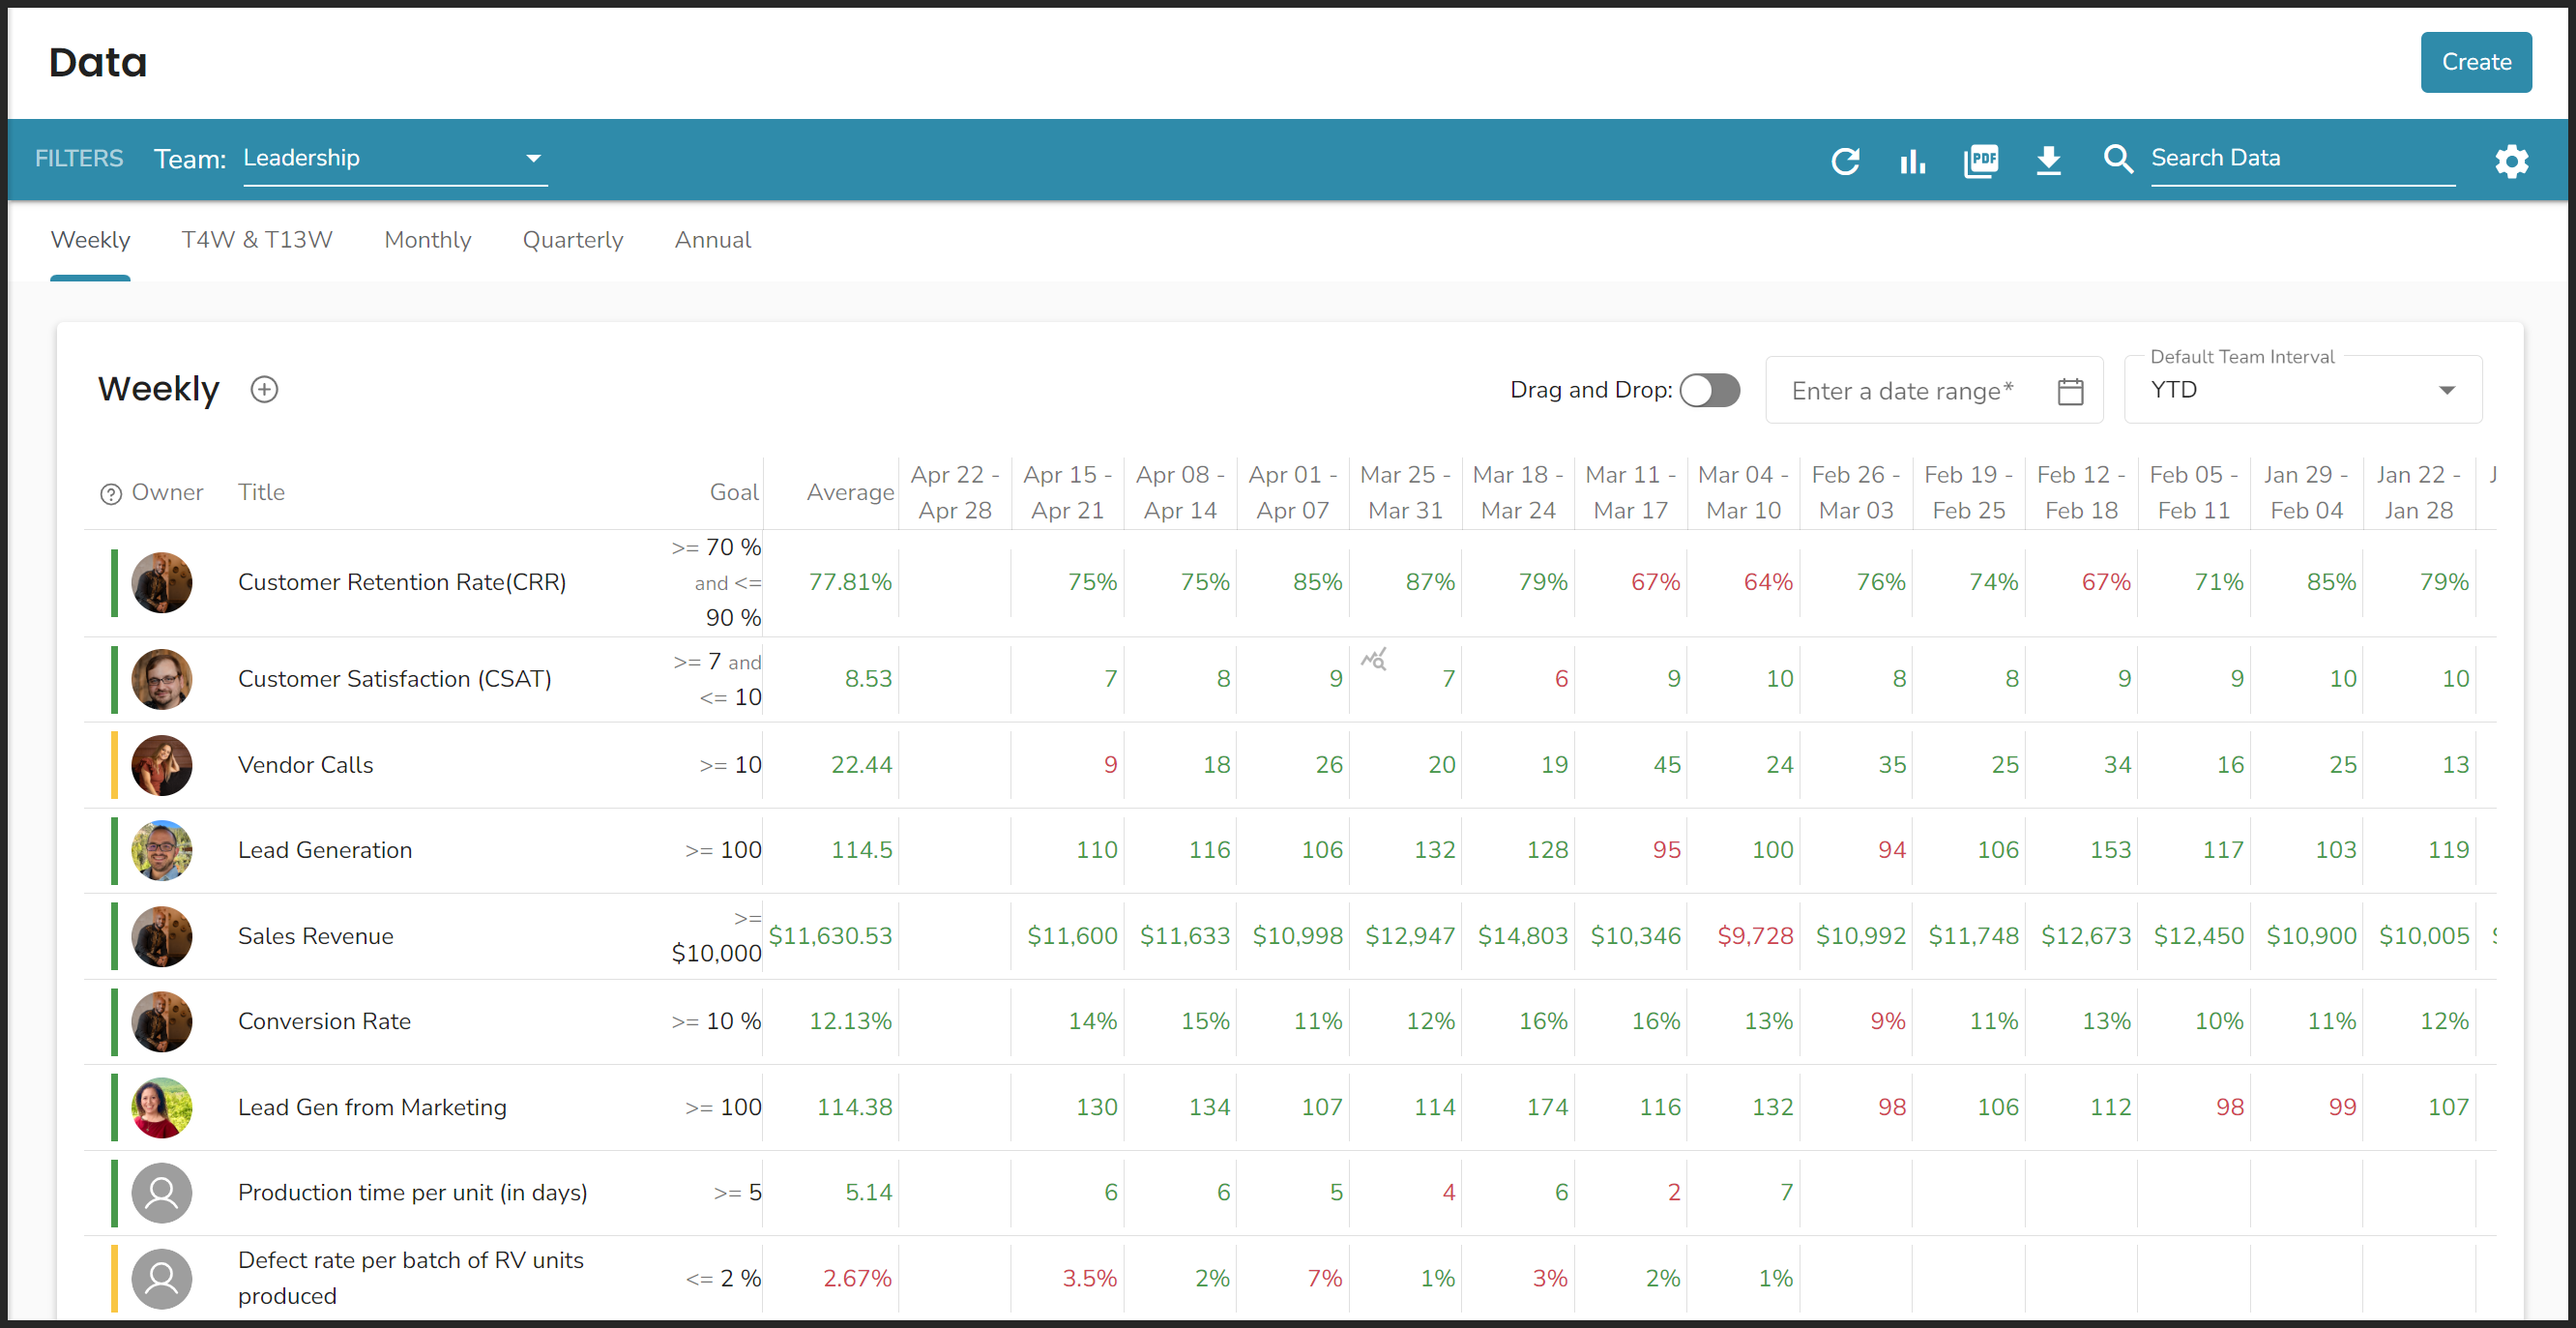
- Organization-wide
- Leadership Team
- Departmental
- Teams
- Individuals
Reviewing the Data tool every week is a critical function of team meetings.
Learn more about making data a superpower for your organization with our free On Data Guide.
Overview of the Data Tool
This article focuses on setting up and organizing your team's Scorecards. Learn how to create, edit, and manage your KPIs here.
📖 Are you new to the Data Tool? Check out our introduction article here.

Operating Scorecards According to Your User Role
The functionality of the Data tool changes based on each user's role in Ninety. Click here for a basic understanding of user permissions for this tool. In short, all licensed users can view and operate their assigned KPIs, while users with Manager or higher level permissions can add KPIs and groups to Scorecards and adjust settings.
Customizing Scorecards
To customize your team's Scorecard settings:
- Click the ellipsis on the far right of the Filters bar.
- Click Settings.
- Toggle off Use company default settings.
From there, you can adjust the settings described in the tabs below.
Show Current Period
To hide the current week’s column from your team’s Scorecard, toggle off Show current period.

KPI Status Inidicator
When the KPI status colors toggle is toggled on, a new column appears on each Scorecard displaying a staus indicator icon. Click on the icon to see a trendline for the KPI over the date range selected. The status indicator's color and symbol are based on each KPI's goal — often called its target.

Red indicates the KPI was off track for the previous three reporting intervals.
Orange indicates the KPI was off track at least once over the previous three reporting intervals.
Green indicates the KPI has been on track for the previous three reporting intervals.
Owner Column
Enabling the Owner column adds a column to all the team's Scorecards to show which user is accountable for each KPI.
Total Column
Enabling the Total column adds a column to all the team’s Scorecards to show the sum total of each KPI.
To change the number of reporting periods for the KPIs on a Scorecard, click the Periods dropdown on the Filters bar.
Average Column
Enabling the Average column adds a column to all the team’s Scorecards to show the average score of each KPI.
To change the number of reporting periods for the KPIs on a Scorecard, click the Periods dropdown on the Filters bar.
Goal Column
Enabling the Goal column adds a column to all the team’s Scorecards to show the goal (target) score of each KPI.
Weekly Start Day
Choose the start day for Weekly KPIs that best fits your organization.
There are two ways to change your Scorecard’s start day, changing it in the Data tool or changing it organization-wide through company settings.
To change it in the Data tool:
- Click Data from the left navigation.
- Click the ellipsis on the far right of the Filters bar.
- Click the KPI Weekly Start Day dropdown.
- Select a weekday.
Resizing Columns
Click and drag to resize any of the following columns in a KPI group:
- Title
- Goal
- Average
You can also expand both the Goal and Average columns at the same time by clicking and dragging the line just before the printed year on the top row of a KPI group.
Double-click one of the above columns to instantly resize a column based on the length of its text.
Freezing and Hiding Columns
The Goal, Average, and Total columns are frozen, so they'll remain in place as your scroll horizontally through your data.
From the Data tool's settings, users with the manager role or above can hide any of the following columns from their team's Scorecard:
- Goal
- Average
- Total
- Owner
Company-Wide Settings
Admins, Owners, and Coaches can set company-wide Scorecard settings from the Configuration page in the Data section of Feature Controls.
Any teams using company default settings match the options here for:
- Average Column
- Total Column
- Status Color Indicator
- Weekly Start Day
Bulk Actions
You can perform the following actions with one or more KPIs from a single group:
- Move to a different group (on the same Scorecard)
- Duplicate
- Create a To-Do
- Create an Issue
- Remove from the group (this option does not delete KPIs)
To perform one or more of the above actions:
- Click one or more checkboxes from KPIs on your Scorecard in the same group.
- Click the Select action button from the top of the same group.
- Choose the action.
Scorecard Filters
The Data tool page has four tabs for Weekly, Monthly, Quarterly, and Annual Reporting.

- Team — Many users are on several teams in Ninety; ensure you have the correct team selected here.
- Date range — Each Scorecard has its own default setting, but you can select any option from the dropdown to analyze your data as needed.
- Periods (Weekly Scorecard only) — Change the reporting period from 1-week columns to 4- or 13-week groupings to see trailing reporting periods.
- Ascending or Descending Toggle — Click the left arrow to view dates from the start of the reporting period to the end or the right arrow to view dates from the end of the reporting period (often the current period) to the start.
Organizing Scorecards
There are several ways to keep your team's Scorecards organized, including creating KPI groups and reorganizing KPIs.
Previously, you may have divided groups of KPIs with line breaks. Our updated tool automatically moved your KPIs into groups based on how you placed line breaks. With the Combine all groups button, you'll have a one-time option to combine all your KPIs into a single group.
Creating KPI Groups
Keep your Scorecards organized by creating groups. Each group can house similar KPIs to make reviewing your Scorecard as easy as possible. You can include up to 20 groups on each of your Scorecards. You may want to create a group for each team member, Seat, or goal. For example, a sales team may have a KPI group that includes a KPI from each sales Seat holder.

To create a new group:
- Click New Group on the far right of the Filters bar.
- Name the group.
- (Optional) Write a description for the group.
- Click Save.
To edit a group's details, click the ellipsis on the top right of the group's card. Then, click Edit group details. To delete it instead, click Delete group.
Expanding and Collapsing Groups
While viewing data, click the diagonal arrow to expand or collapse a group.
Reorganizing Groups
To manage the order of your KPI groups:
- Click the ellipsis on the far right of the Filters bar.
- Click Edit group order.
- Click and hold the six-dot icon on the left of the group's row to drag and drop groups in the popup.
- Click Save.
The order of your KPI groups carries over to your team's meeting agenda, so team leaders should organize the Scorecards accordingly.
Reorganizing KPIs
You can drag and drop a KPI within its group by clicking and holding the dots on the far left of the KPI's row and then releasing your click in its new location.

To send a KPI from one group to another:
- Right-click the KPI.
- Click Move to group… from the dropdown.
- Select a group from the dropdown.
- Click Move.
Printing or Downloading Scorecard Data
Users with the role of Manager or higher can print their Scorecard as a PDF or export their data as a CSV document. Here's how:
- Click the ellipsis on the far right of the filters bar.
- Click Export as CSV or Print PDF from the dropdown.
The chosen document includes all data currently visible on your Scorecard tool. To change which information is downloaded, adjust the item(s) selected on the filters bar or change to a different Scorecard (Weekly, Monthly, Quarterly, or Annual). The exported data does not include notes from individual cells on your Scorecard.
Frequently Asked Questions (FAQs)
What happened to trailing Scorecards?
We've made trailing Scorecards easier than ever; you can still view your KPIs in trailing 4- or 13-week intervals to see trends over time.
The trailing scorecard was a temporary solution in the previous iteration of the Data tool. You can achieve a similar effect by clicking the Period dropdown and selecting 4-week (read-only) or 13-week (read-only).
How do I change a KPI's owner?
There are two ways to change a KPI's owner:
- Click the KPI's title to open its details card.
- Click the profile photo on the top right of the card.
- Hover over a Seat from the dropdown.
- Click one of the users who occupy that Seat.
Or:
- Click the KPI's title to open its details card.
- Click the KPI Owner dropdown toward the bottom of the details card.
- Choose a Team Member.
- (Optional) Select the relevant Seat from the Seat dropdown if this user sits in multiple Seats.
What does it mean to own a KPI?
To “own” a KPI means to be accountable for its success. Each KPI's owner has their profile picture featured on the Scorecard. KPI owners should create an Issue about their KPI whenever it’s off track, needs updating, or has consistently surpassed its target.
How do I move a KPI from one group to another?
To move a KPI from one group to another:
- Right-click the KPI.
- Click Move to group… from the dropdown.
- Select a group from the dropdown.
- Click Move.
How do I enter my KPI's scores?
All licensed users can be assigned KPIs and input data for any of their team's KPIs. Input scores for your KPIs from the My 90 page or the Data tool page. The My 90 workspace shows all the KPIs you own across every team.
To add scores in My 90:
- Click My 90 from the left navigation.
- Scroll to the Scorecard section.
- Type in your scores to the corresponding KPI and reporting period cell.
- Click the Period Interval dropdown to access your Trailing, Monthly, Quarterly, and Annual Scorecards.
To enter scores using the Data tool:
- Click Data from the left navigation.
- Choose a team from the Team dropdown.
- Click another Scorecard tab to switch away from the Weekly Scorecard.
- Locate the KPI.
- Type the score in the reporting period cell.
- Press your tab key to move one cell to the right or press shift + tab to move one cell to the left.